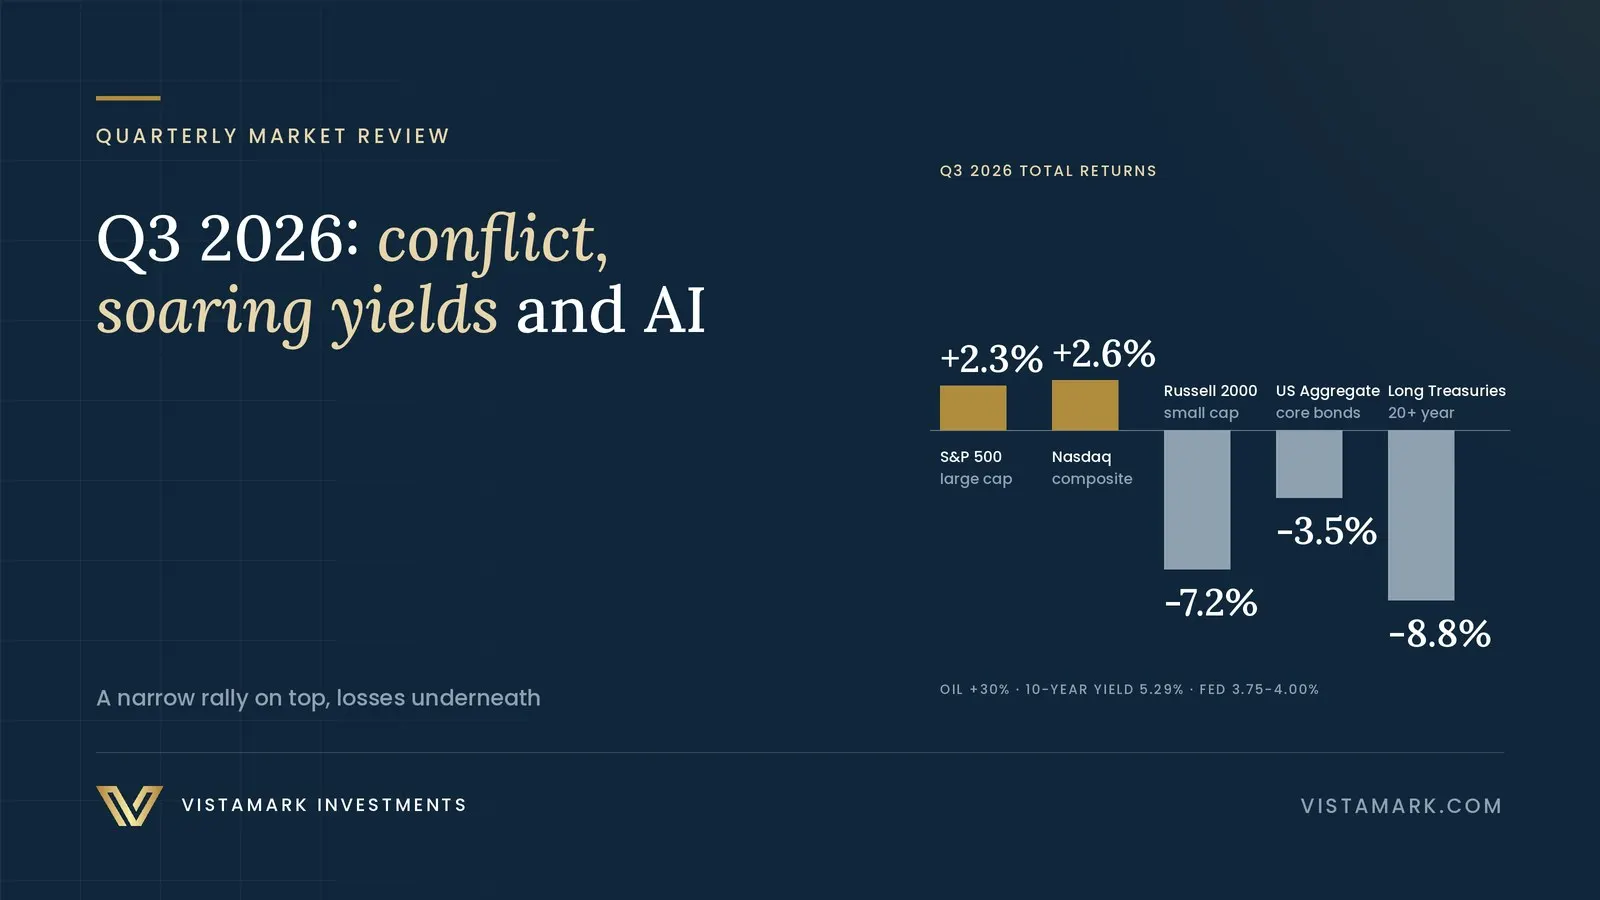
The third quarter reversed nearly every comfort the second quarter provided. The June ceasefire with Iran collapsed in its third week, the Strait of Hormuz closed again, and crude oil rose roughly 30%. Inflation that had been easing found a new source of pressure, Treasury yields climbed to levels last seen in 2007, and the Federal Reserve raised interest rates for the first time since 2023. The S&P 500 still finished the quarter higher, but the gain rested on a narrow group of large technology companies while small caps, the Dow, and most of the market declined. For diversified investors, the quarter carried a lesson that complements the last one: when leadership narrows and stocks and bonds begin responding to the same headline, balance has to be maintained deliberately.
| Measure | Value | Note |
|---|---|---|
| S&P 500 · Q3 | +2.3% | Total return |
| Russell 2000 · Q3 | -7.2% | After +21.5% in Q2 |
| WTI Crude · Q3 | +30% | Settled $90.53 on September 30 |
| Fed Funds Target | 3.75-4.00% | Raised September 16 |
What Happened, and What It Means
Three months ago, we closed our second quarter review by noting that the quarter had ended well but had not ended settled. The peace with Iran was a framework rather than a treaty, inflation stood at multi-year highs, and a new Fed chairman had put rate hikes on the table. The third quarter tested each of those conditions, and each one moved in the less comfortable direction.
The ceasefire collapsed on July 8 after renewed attacks on shipping near Oman, the United States reinstated its naval blockade of Iranian ports on July 14, and the 60-day memorandum signed in June expired in mid-August without an extension. Oil, which had fallen roughly 30% in the second quarter, recovered the entire decline: West Texas Intermediate crude rose about 30% in the third quarter to settle at $90.53, and Brent rose about 34%. Diesel set repeated national records, peaking at $6.53 per gallon in late September.
The energy rebound arrived just as inflation had begun to ease, and the Federal Reserve responded. After holding rates on a divided vote in July, the committee raised its benchmark rate by a quarter point on September 16, unanimously, and signaled more to come. Treasury yields moved sharply higher: the 10-year climbed from roughly 4.4% at the end of June to 5.29% in the final days of September, and the 30-year touched 5.47%, its highest level in 22 years.
Equities absorbed all of it at the index level and very little of it below. The S&P 500 returned 2.3% for the quarter and the Nasdaq 2.6%, carried by artificial intelligence leaders such as Nvidia, which gained roughly 17%. The Dow fell 2.3% and the Russell 2000 dropped 7.2% after a 21.5% second quarter. By quarter end, the S&P 500 sat within about 2% of its 52-week high even as 83% of its members traded more than 10% below their own highs. The headline numbers held; the average stock did not.
The Scoreboard: How Major Asset Classes Fared in Q3 and Year to Date
| Asset Class | Index | Q3 2026 | YTD 2026 |
|---|---|---|---|
| Fixed Income | |||
| Cash | Bloomberg US Treasury Bills 1-3 Month | +0.9% | +2.8% |
| Short-Term Bonds | Bloomberg US Government/Credit 1-3 Year | -0.2% | +0.6% |
| US Core Bonds | Bloomberg US Aggregate | -3.5% | -2.9% |
| Municipal Bonds | Bloomberg Municipal 1-15 Year | -5.1% | -3.8% |
| High Yield Munis | Bloomberg Municipal Bond High Yield | -5.5% | -1.7% |
| Inflation-Protected | Bloomberg US TIPS (Series-L) | -3.2% | -2.1% |
| Global Bonds | Bloomberg Global Aggregate | -2.5% | -2.7% |
| US High Yield | Bloomberg US Corporate High Yield | -1.8% | +0.1% |
| Long Treasuries | ICE US Treasury 20+ Year Index Total Return | -8.8% | -7.9% |
| Preferred Stock | S&P/TSX North American Preferred Stock Index | +0.2% | +4.1% |
| Global & U.S. Equity | |||
| Global All Cap | MSCI ACWI IMI Net Total Return | +1.1% | +13.0% |
| Global Equity | MSCI ACWI Net Total Return | +1.6% | +13.0% |
| US Total Market | Russell 3000 Total Return | +1.4% | +12.4% |
| US Large Cap | S&P 500 Total Return | +2.3% | +12.7% |
| US Large Value | Russell 1000 Value Total Return | +2.6% | +19.3% |
| US Large Growth | Russell 1000 Growth Total Return | +0.9% | +6.3% |
| US Mid Cap | Russell Midcap Total Return | -3.0% | +11.8% |
| US Mid Value | Russell Midcap Value Total Return | -2.0% | +15.3% |
| US Mid Growth | Russell Midcap Growth Total Return | -5.8% | +1.0% |
| US Small Cap | Russell 2000 Total Return | -7.2% | +13.7% |
| US Small Value | Russell 2000 Value Total Return | -4.9% | +17.0% |
| US Small Growth | Russell 2000 Growth Total Return | -9.4% | +10.7% |
| International Equity | |||
| Developed International | MSCI EAFE Net Total Return | +0.8% | +10.3% |
| Emerging Markets | MSCI Emerging Markets Net Total Return | -0.4% | +23.4% |
| Real Assets & Alternatives | |||
| Real Estate | S&P 1500 Real Estate (Sector) Total Return | -5.9% | +5.3% |
| Digital Assets | Bitcoin | +39.0% | -5.7% |
| US Dollar | Invesco DB US Dollar Index Bullish Fund | +1.3% | +6.4% |
| Gold | SPDR Gold Shares | +3.4% | -3.9% |
Source: Vistamark Bloomberg internal data systems. Third quarter returns cover June 30 through September 30, 2026, and year-to-date returns cover December 31, 2025 through September 30, 2026, in USD. Bitcoin returns calculated by Vistamark from Bloomberg closing levels of $60,152.36 on June 30, 2026 and $83,640.10 on September 30, 2026, and the January 1, 2026 reference price of $88,722. Index returns do not reflect fees or expenses.
The bond market told the quarter's central story. Yields rose across the curve as the energy shock, a hawkish Fed, and heavy Treasury issuance converged, and the move intensified in September: the 10-year yield posted its sharpest weekly rise since March in the final full week of the quarter, crossing 5.10% on September 23 for the first time since July 2007 after a poorly received five-year note auction. Because bond prices move in the opposite direction of yields, that meant losses for longer-dated bonds. The long Treasury index fell 8.8% for the quarter and the broad Bloomberg US Aggregate lost 3.5%, while Treasury bills returned 0.9% and short-term bonds were roughly flat. Municipal bonds, sensitive to the same rate pressure, fell more than 5%. A Treasury Department program, expanded in August, to buy back older long-dated debt provided only brief relief.
Leaders and Laggards: Style, Size, Sector, and Geography
The second quarter's rally was broad. The third quarter's was not. Nearly every category that led the recovery in the spring gave ground in the summer, and the gains that remained concentrated in the largest technology companies.
+2.6% · Nasdaq Composite · Q3 2026
Large technology carried the quarter. Nvidia gained roughly 17%, the Nasdaq set multiple record closes, and the AI trade revived in late September on new infrastructure commitments. Year to date, the Nasdaq leads the headline U.S. indexes at 16.1%.
-7.2% · Russell 2000 · Q3 2026
Small caps gave back a third of their second quarter gain. Smaller companies borrow at floating rates and refinance more often, so rising rates and a hawkish Fed weigh on them first. They remain up 13.8% for the year.
-2.3% · Dow Jones Industrial Average · Q3 2026
The Dow ended the quarter 5.1% below its August peak and fell more than 4% in September alone, reflecting pressure on industrials, financials, and consumer companies exposed to fuel costs and higher borrowing rates.
+34% · Brent Crude · Q3 2026
Oil reversed its entire second quarter decline and more. Brent rose about 34% for the quarter and is up about 61% for the year, while U.S. diesel set successive records.
Breadth deteriorated sharply in September. Nine of eleven large-cap sectors finished the month meaningfully lower, and for the full quarter utilities, industrials, and real estate fell the furthest as rising yields pressured rate-sensitive businesses. Equal-weighted, mid-cap, and small-cap indexes all declined more than the cap-weighted S&P 500, which is the arithmetic of a market whose largest members account for an outsized share of its return.
Style and geography did not follow the headline indexes. Despite the attention on large technology, large-cap value outperformed growth for the quarter, returning 2.6% against 0.9% for the Russell 1000 Growth index, and extended its year-to-date lead to 19.3% versus 6.3%. The largest growth companies carried the cap-weighted indexes, but the broader growth universe did not: small-cap growth fell 9.4% and mid-cap growth 5.8%. Internationally, developed markets edged up 0.8% for the quarter and emerging markets slipped 0.4%, a pause after a strong first half; emerging markets remain the leading equity category in our scoreboard year to date at 23.4%. The dollar rose 1.3%, gold gained 3.4% despite a 6.8% September decline, and Bitcoin rose 39.1%.
The Vistamark View
Last quarter, nearly every overlooked category led. This quarter, the market narrowed back toward a handful of large technology companies. Leadership reversed within a single quarter, in both directions, which is precisely why we do not build portfolios that depend on predicting it.
A market in which the index sits near its highs while most of its members sit well below theirs is not necessarily fragile, but it is concentrated. Concentration rewards investors as long as the leaders deliver, and it offers little cushion when they do not. That is the practical argument for the diversified allocation across style, size, and geography that our capital market assumptions favor: it will rarely be concentrated in whatever happens to lead, and it is designed never to depend on it.
The Ceasefire Unravels: A Second Chokepoint and a 30% Rebound in Oil
We wrote in July that the market variable to watch had shifted from whether tankers could move to what the strait's traffic would cost. The third quarter answered with a more difficult question: whether the strait would remain open at all. We continue to acknowledge, first and foremost, that this is a human conflict whose consequences extend well beyond capital markets.
- July 7 - 8: Iranian attacks on commercial vessels off the coast of Oman prompt U.S. airstrikes. The President declares the June memorandum no longer in force, and the ceasefire collapses on July 8.
- July 14 - 24: The United States reinstates its naval blockade of Iranian ports. Houthi forces in Yemen declare a blockade of the Bab al-Mandeb Strait, and insurance markets withdraw coverage for Saudi-linked vessels, cutting tanker traffic through the Red Sea gateway.
- Early to Mid-August: Iran and Oman negotiate a draft framework for managing traffic through the strait. The 60-day memorandum window formally expires on August 17, and Iran moves to enforce its own transit regime.
- Late August: Washington launches a broad financial campaign to isolate Iran, including secondary penalties on its trading partners. U.S. forces strike Iranian missile launchers near the strait, and Iran fires missiles at bases housing U.S. forces in Jordan, nearly all of which are intercepted.
- Early September: Iran fires ballistic missiles at two U.S. warships, which evade the attack without injuries. U.S. forces respond by striking three Iranian oil tankers. Reporting indicates the blockade has halted new Iranian oil exports from the Gulf.
- Mid-September: Houthi forces capture Yemen's Red Sea coastline and the island at the mouth of the Bab al-Mandeb Strait, giving Iran-aligned forces leverage over a second chokepoint. Drone strikes force Saudi Arabia to shut its East-West pipeline, the main export route that bypasses Hormuz.
- September 25 - 27: At the United Nations, Iran proposes reopening the strait within seven days in exchange for lifting the blockade and sanctions on its oil sales. The President rejects the offer on September 26, while both sides describe discussions through mediators as continuing into October.
For markets, the direction of travel reversed. West Texas Intermediate traded from a low near $67 in early July to a high near $107 in mid-September, averaging about $86 for the quarter, and settled at $90.53 on September 30. Brent settled at $98.03. Supply has partly adapted: Saudi Arabia exported roughly 6 million barrels per day in September through alternative routes, and meaningful volume moved through the U.S.-managed Hormuz corridor late in the quarter. But the Energy Information Administration estimates global oil inventories have fallen by roughly 400 million barrels this year, and it expects prices to stay elevated through year-end.
Households felt the rebound most directly at the pump, and businesses felt it in diesel. The national average for regular gasoline reached $4.48 per gallon on September 24, the highest ever recorded for that point in the calendar. Diesel, the fuel that moves freight and powers agriculture and construction, set successive records in September and peaked at $6.53 per gallon on September 22, more than 70% above a year earlier. Diesel's sharper rise reflects a refining shortage layered on top of the crude disruption, with the Energy Information Administration forecasting U.S. distillate inventories below 100 million barrels, and it is the channel through which the conflict reaches the price of nearly every physical good.
| Measure | Value | Note |
|---|---|---|
| WTI Crude | $90.53 | September 30 settle, up ~30% in Q3 |
| US Average Gasoline | $4.48 | Per gallon, September 24 |
| US Average Diesel | $6.53 | Record high, September 22 |
The Fed Turns: From a Divided Hold to a Unanimous Hike
The question that closed our last review, will the Fed hike, was answered in September. At the July 28 to 29 meeting, the committee held the federal funds rate at 3.50% to 3.75%, with three regional presidents dissenting in favor of an increase. Seven weeks later, on September 16, Chair Kevin Warsh's committee raised the target range by a quarter point to 3.75% to 4.00%, its first increase since 2023, on a unanimous 12 to 0 vote. The accompanying projections showed 16 of 18 officials expecting at least one more increase before year-end.
The path from there has been volatile. Odds of a second hike at the October 27 to 28 meeting climbed to roughly 70% in late September as yields surged and business surveys showed accelerating activity and rising input costs. Two reports in the final days of the quarter and the first days of the fourth reversed that move. August's personal consumption expenditures price index, the Fed's preferred inflation gauge, rose 3.4% from a year earlier, below the 3.7% economists expected. Then the September jobs report showed just 29,000 jobs added. By October 2, the probability of an October hike had fallen to roughly 17% to 22% per the CME FedWatch Tool, while the odds of an increase by the December meeting remained above 75%.
The Fed's dilemma has sharpened rather than eased. Energy prices are pushing headline inflation and household inflation expectations back up at the same moment hiring is slowing and wage growth is cooling. Hiking further risks tightening into a softening labor market; pausing risks letting an energy shock settle into broader prices. The market's current answer, skip October and act in December, reflects that tension rather than resolving it.
| Measure | Value | Note |
|---|---|---|
| Fed Funds Rate | 3.75-4.00% | After the September 16 hike |
| 10-Year Treasury | 5.29% | Late September, from ~4.4% in June |
| October Hike Odds | ~20% | CME FedWatch Tool, October 2 |
| December Hike Odds | 75%+ | CME FedWatch Tool, October 2 |
The Data: Growth Revised Up, Hiring Slowed, and Inflation Paused
Growth proved stronger than first reported. The advance estimate of second quarter GDP, released July 30, showed the economy growing at a 1.5% annualized rate, and the second estimate in late August confirmed it. The third estimate on September 30 revised growth up to 2.2%, reflecting stronger investment, consumer spending, and government spending, while first quarter growth was revised up to 2.5%. The Atlanta Fed's GDPNow model, a real-time estimate rather than an official forecast, tracked third quarter growth near 5% for much of the summer before easing to 3.7% on September 30. The official advance estimate arrives October 29.
The labor market lost momentum. July's report showed a decline in payrolls, August rebounded with a gain now revised to 133,000, and September added just 29,000 jobs against expectations above 80,000. Revisions lowered July and August by a combined 60,000. The unemployment rate rose to 4.2%, partly because more people entered the workforce, and annual wage growth slowed to 3.0%, the lowest since May 2021. Hiring has slowed without widespread layoffs, a pattern consistent with employers growing cautious about rising costs.
Inflation eased, then stalled. Headline consumer price inflation fell from 4.2% in May to 3.4% in July and held there in August as the second quarter's oil collapse worked through the data, while core consumer prices ran far cooler. Producer prices were firmer, and the third quarter's energy rebound has not yet fully reached consumer price indexes. Households expect it to: the University of Michigan's final September sentiment index fell to 48.1, a four-month low, as fuel and grocery costs weighed on their finances. Higher yields also reached housing, with the average 30-year fixed mortgage rate climbing above 7.0%, its highest since January 2025.
| Measure | Value | Note |
|---|---|---|
| Q2 GDP (Third Estimate) | +2.2% | Revised up from 1.5% |
| GDPNow · Q3 Tracking | 3.7% | September 30 |
| September Payrolls | +29,000 | Unemployment 4.2% |
| August PCE (YoY) | 3.4% | Below the 3.7% expected |
| Wage Growth (YoY) | 3.0% | Lowest since May 2021 |
| S&P 500 Q3 EPS Growth (Est.) | +29.5% | FactSet, year over year; revenue +12.3% |
Earnings remain the market's foundation. FactSet projects S&P 500 earnings growth of 29.5% for the third quarter compared with a year earlier, on revenue growth of 12.3%, which would mark a third consecutive quarter of earnings growth above 25%. Analysts raised their third quarter estimates by 1.4% during the quarter, an unusual pattern, since estimates typically decline as a quarter progresses. Upward estimate revisions were led by energy and information technology. Profits are doing real work in supporting prices; the reporting season that begins in mid-October will test whether that strength extends beyond the largest companies.
Three Ways the Fourth Quarter Could Go
The fourth quarter opens with the same two dominant variables as the third, now tightly linked: whether the Strait of Hormuz reopens, and how far the Federal Reserve goes. With oil prices and Treasury yields moving together more closely than at any point in 35 years, the answer to the first question largely determines the answer to the second.
Constructive
Talks through mediators produce a path to reopening the strait, the blockade eases, and oil falls back toward the $70s. Headline inflation resumes its decline, the Fed skips October and December hike odds fade, and long-term yields retreat from their highs, relieving pressure on stocks and bonds at the same time. Third quarter earnings broaden beyond technology, and small caps and value recover some of their lost ground.
Base Case
Diplomacy continues without a breakthrough and both chokepoints remain partially impaired. Oil ranges between $80 and $100, the Fed holds in October and raises rates once more in December, and the 10-year yield stays near 5%. Strong earnings keep the major indexes within reach of their highs while leadership remains narrow, and volatility rises around the November 3 midterm elections without changing the trend.
Tail Risk
Direct military exchanges escalate, the Red Sea route closes further, and oil moves decisively above $110. Inflation reaccelerates, the Fed hikes more than once into a slowing labor market, and long-term yields break above their 2007 highs. A market whose gains rest on a small group of companies, with stocks and bonds responding to the same shock, would leave few places to shelter. This is the scenario against which we hold genuinely diversifying assets.
What Q3 Means for the Decade Ahead
Each quarter we test the key inputs to our 2026 to 2035 capital market assumptions against current conditions. The third quarter moved the inputs in different directions.
Equity valuations: little changed, but more concentrated. Our assumptions start from an S&P 500 valuation of 25.5 times earnings, in the 96th percentile of history since 1957, which is the primary reason our ten-year U.S. large cap forecast sits at 5.39% annualized. A 2.3% quarter did little to change that starting point. What changed is the composition: with the index's return increasingly dependent on its largest members, the case for the cheaper corners our assumptions favor, emerging markets at 6.70%, developed international at 6.28%, small cap at 5.78%, and mid cap at 5.64%, is stronger after a quarter in which several of those categories lagged.
Bond yields: more constructive. Our 4.27% ten-year forecast for core bonds is anchored to the starting yield of the Bloomberg US Aggregate, a relationship that has explained roughly 90% of the index's subsequent ten-year returns historically. The third quarter's losses in longer bonds were painful, but they came with higher starting yields, and higher starting yields have historically meant higher forward returns. In our framework, the quarter improved the decade-ahead outlook for core bonds even as it hurt recent returns.
Inflation: the swing factor, again. Our ten-year inflation assumption of 2.23% is derived from the bond market's own expectations. The question we raised last quarter, whether the energy spike would remain an event rather than a regime, is now being asked a second time. Household survey expectations have moved higher with fuel prices, and a second energy shock in two quarters raises the risk that businesses and consumers begin to treat elevated inflation as normal. That remains, in our view, the input we are watching closely ahead of our next annual review.
What We Are Watching
- Mid-October · Third quarter earnings season. FactSet projects year-over-year S&P 500 earnings growth of 29.5% on revenue growth of 12.3%. The key question is whether strength extends beyond the AI leaders, and how companies describe fuel costs, borrowing costs, and demand heading into 2027.
- Mid-October · September CPI. The first consumer price reading to capture September's oil surge and record diesel prices, and the last before the Fed meets. August held at 3.4%; a move higher would revive October hike odds quickly.
- October 27 - 28 · FOMC meeting. Markets price only about a one-in-five chance of a hike per the CME FedWatch Tool. The statement and Chair Warsh's press conference will matter more for what they signal about December.
- October 29 · Q3 GDP advance estimate and September PCE. GDPNow tracked third quarter growth at 3.7% at quarter end. A strong growth reading alongside firm inflation would strengthen the case for further tightening.
- November 3 · Midterm elections. Midterm years have historically brought elevated autumn volatility followed by firm twelve-month forward returns. Energy policy, the conflict, and fiscal priorities are all indirectly on the ballot.
- December 9 · Final FOMC decision of 2026. The CME FedWatch Tool prices better than 75% odds of a hike by this meeting. A new set of projections will show how far officials expect the cycle to run into 2027.
- Ongoing · U.S.-Iran talks, Hormuz, and Bab al-Mandeb. Discussions continue through mediators after Washington rejected Iran's seven-day proposal. Tanker traffic through both chokepoints and repair progress on Saudi Arabia's East-West pipeline are the tape to watch.
- Ongoing · The long end of the Treasury curve. The 30-year yield touched 5.47% in late September. Whether it holds below its 2007 highs, and how Treasury auctions are received, will shape mortgage rates, corporate borrowing costs, and equity valuations alike.
The Quarter's Real Lesson
In early July, with a ceasefire in place, oil near $70, and small caps coming off a 21.5% quarter, it would have been natural to assume the second quarter's conditions would persist. Within three months, the ceasefire had collapsed, oil had risen roughly 30%, the Fed had begun raising rates, and small caps had fallen 7.2%. The S&P 500 still finished higher, but only because a small group of companies carried it.
Taken together with the first half, the year so far offers a clear demonstration of why we invest the way we do. Leadership has rotated sharply in each of the three quarters, and an investor positioned for any single quarter's winners would have been poorly positioned for the next. Diversification across asset classes, styles, sizes, and geographies does not prevent difficult quarters. It keeps any one of them from defining the outcome.
Our VistaBuilder™ and VistaBalancer™ platforms continue to run scenario analysis across the paths described above and will rebalance portfolios deliberately as conditions evolve, trimming what the narrow rally has extended and adding to what it has left behind. Please reach out if you would like to discuss how the third quarter and the current environment relate to your specific portfolio, goals, or long-term plan.
Balance Maintained Deliberately
When leadership narrows and stocks and bonds begin responding to the same headline, a balanced portfolio requires active attention rather than assumption. VistaBuilder™ constructs allocations with attention to what actually drives each holding, and VistaBalancer™ keeps those allocations on target as conditions shift. If you are uncertain how concentrated your portfolio has become this year, we would welcome a conversation.
Sources: FactSet Research Systems (index returns and Earnings Insight) as reported by third-party quarterly recaps, October 1-2, 2026; CNBC, Yahoo Finance, and TheStreet market coverage, September 23-30, 2026; Nasdaq.com September 2026 Review and Outlook; Bureau of Economic Analysis (GDP, Third Estimate, Second Quarter 2026, September 30, 2026); Federal Reserve Bank of Atlanta (GDPNow, September 30, 2026); Bureau of Labor Statistics (Employment Situation, October 2, 2026; Consumer Price Index) as reported by Bloomberg, CNBC, CNN, and NPR; Commerce Department (Personal Income and Outlays, August 2026) as reported by TheStreet; University of Michigan Surveys of Consumers; Federal Reserve Board (FOMC statements, July and September 2026); CME Group (FedWatch Tool, October 2, 2026) as reported by CNBC and others; oil settlement prices as reported by the Associated Press via Yahoo Finance, September 30, 2026; LSEG oil price data as reported by Reuters, September 30, 2026; AAA (gasoline and diesel prices, September 2026); U.S. Energy Information Administration (Short-Term Energy Outlook, September 2026); Kpler export data as reported by CNBC; Congressional Research Service, International Crisis Group, Al Jazeera, HSToday, CNN, NBC News, CBS News, and the Associated Press (Strait of Hormuz, Red Sea, and diplomatic developments, July-September 2026); Vistamark Investments (2026-2035 Capital Market Assumptions). GDPNow is a model-based nowcast and is not an official forecast of the Atlanta Fed or the Federal Reserve System. Index returns reflect total return in USD through the September 30, 2026 market close unless otherwise noted, and do not reflect fees, expenses, or transaction costs; indexes are not available for direct investment. Index return data sourced from Vistamark Bloomberg internal data systems as of the September 30, 2026 close; Nasdaq Composite and Dow Jones Industrial Average figures from FactSet. Capital market assumption forecasts are estimates only and not guarantees of future results. Past performance is not indicative of future results. This material is for informational purposes only and does not constitute investment advice or a recommendation regarding any specific security. Vistamark Investments is a registered investment adviser. © 2026 Vistamark Investments. All rights reserved.
Market Compass · weekly
Get the Compass by email
One concise recap of the week’s market-moving events and what to watch next, written by our CIO at the end of each market week. No sales follow-up; unsubscribe any time.

Founder and CIO of Vistamark; as CIO of Fiducient Advisors, oversaw investment strategy for more than $260 billion in client assets. More about Matthew →
This article is for informational and educational purposes only and does not constitute investment, legal, tax or accounting advice, or an offer or solicitation to buy or sell any security. Views are those of the author as of the publication date and are subject to change. Vistamark Investments is an SEC-registered investment adviser; see our disclosures.